Hey Fortune Hunters. We were getting ready to do a YouTube video on an indicator called Trend Magic. It pops up all the time in search results as being a helpful indicator for trend following and momentum trading – and it’s really easy to use.
If you don’t have a copy, there are a couple of places to find it. ForexFactory.com forums is one area that’s popular with traders who are looking for new custom indicators that aren’t included in their Metrader broker’s default list. Or for those who would rather not bother searching around, just send me an email at info@fxfortunehunter.com and I will send you a link to my DropBox.com area.
I’ve had bronchitis for about a month! Geez… And I’m afraid I will have a coughing fit if I do the video now. So, I decided to put the updated 2019 information about Trend Magic in this blog post so you could get it right away. Also, I thought this would be a good way to combine the Trend Magic research with a currency market review.
Today is Tuesday, January 15th and we are waiting for the British Parliament to vote on Prime Minister May’s Brexit plan. So I have chosen a 15 minute chart of the Pound versus the U.S. dollar to illustrate the case study. In my opinion, the back story is simple. If May loses the vote, we expect it will be bad for the Pound. With only a few weeks to go before the Brexit deadline in March, if there is no deal, Great Britain may well “crash” out of the European Union leaving only chaos for businesses and folks who have grown used to travelling back and forth the continent. Simply stated, no deal means no rules! Ugly situation.

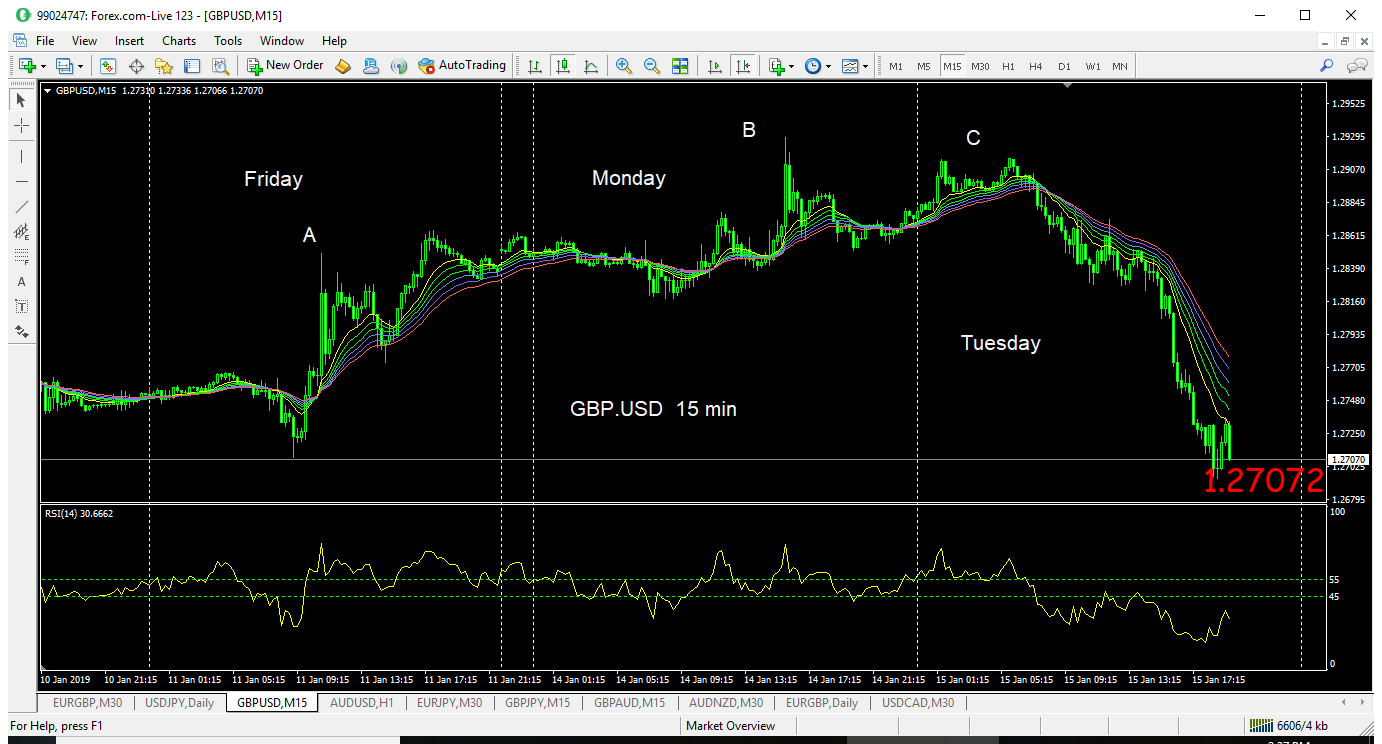
As you can see in the first chart, the British pound moved higher on some optimism about the outcome on Friday of last week (Point A) and continued to a peak value after the short Sunday session into Monday. (Point B) Price maintained the upslope into the Asian session Tuesday and created a double top at Point C on the chart. Then it reversed and fell dramatically in advance of the vote Tuesday evening, London time.
The question for us now is how well did our own basic indicators do in predicting the reversal – AND – did Trend Magic add value?
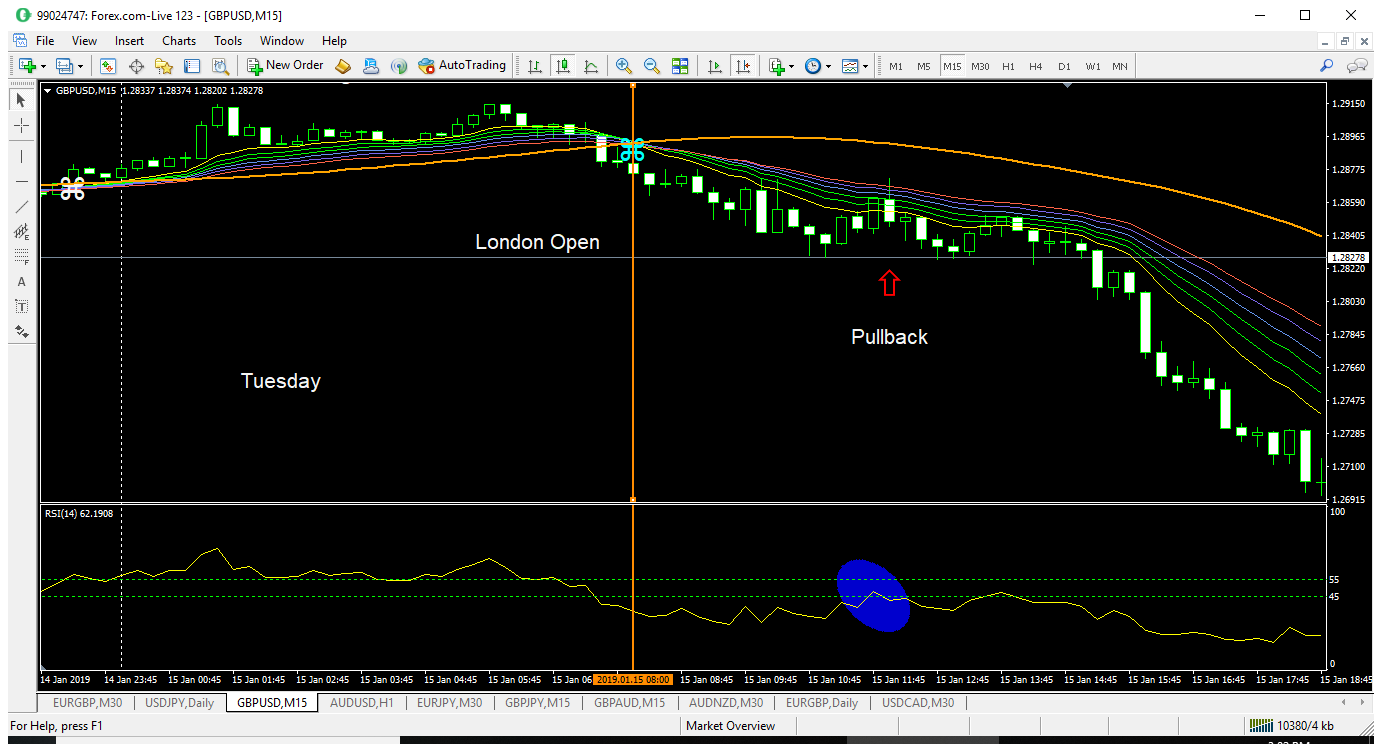
First of all, let’s add the Medallion crossover indicator to our multiple moving averages, plus a T3 Tilson with an orange dashed line (set to 38) to see if we catch the reversal. This is the basic template we use each day – no matter the timeframe. The Medallion Crossover was programmed for us 10 years ago, in 2009!

The Blue Medallion is visible at the London Open, 3 AM New York time. This means there has been a twist in the moving averages with the 12 EMA crossing down through the 24 EMA. Typically, I will wait for a pullback into the bands before entering this kind of trade short. This gives you less risk with your stop loss up to the T3 Tilson which I use to negate the trade. In this case, it’s pretty interesting that the T3 crossover occurs at the same time as the 12/24 twist.
You can also see that I use a Relative Strength Index oscillator in the bottom pane of the chart. I use inputs of 45 and 55 with the RSI to create a mid-section on the oscillator. Note how during the pullback, the RSI moves into the 45-55 range without being able to move above it. Moving higher than 55 can be used to invalidate the trade. This was a lowest risk place for the short. (See the blue ellipse).

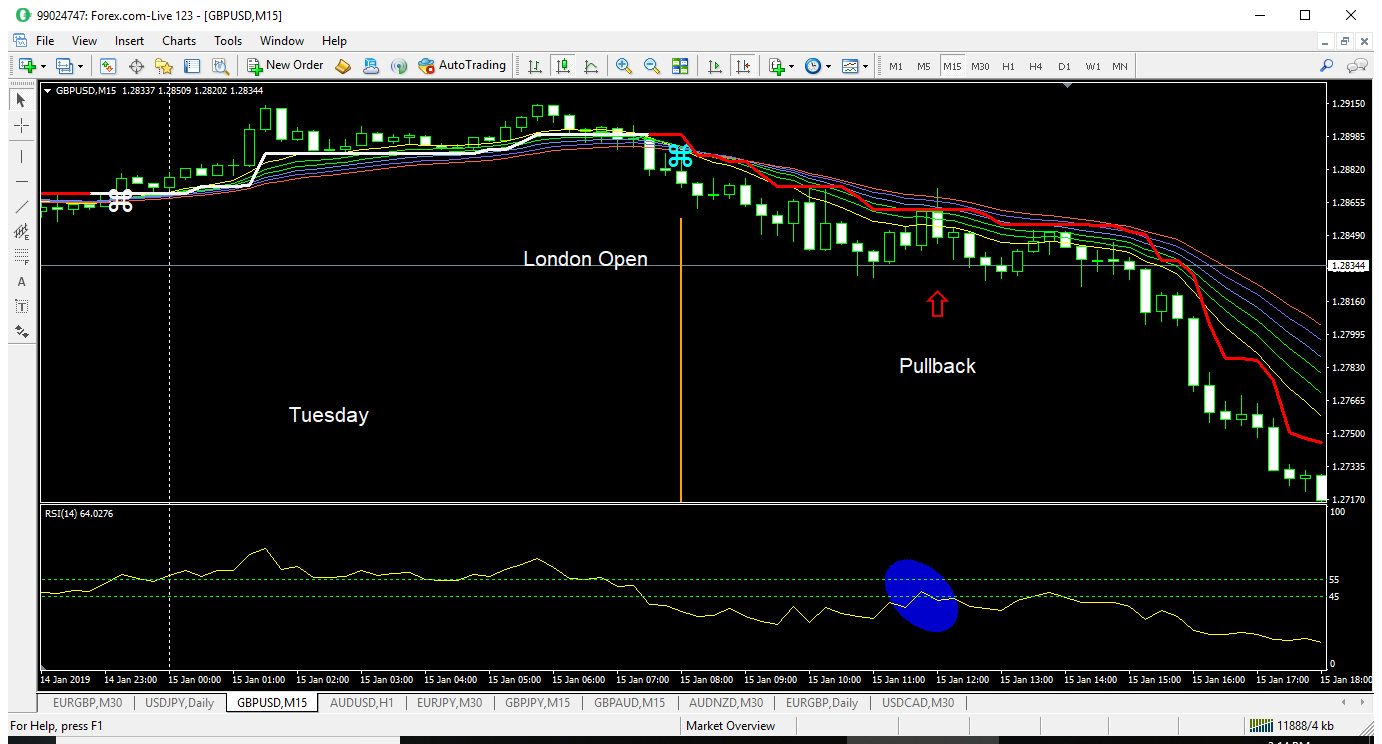
In the third chart snapshot, we have added the Trend Magic indicator. In the inputs, we increased line width to 3 so that it would be clear. This is the same 15 min view of the GBP.USD. I shortened the London Open orange vertical line so it wouldn’t interfere with the crossover section. Note that the Trend Magic changed from White (higher) to Red (lower) just a couple of minutes earlier than our crossover medallion.
Our fundamental Multiple Moving Averages template was pretty well synchronized with the Trend Magic indicator as the reversal occurred. So that’s encouraging. What’s even better? Note that as our pullback into the bands took place at the point of our entry, price pushed up to the Trend Magic line – but then failed. I have found in using Trend Magic that this failure is a great place to take the trade – even without other supporting indicators.
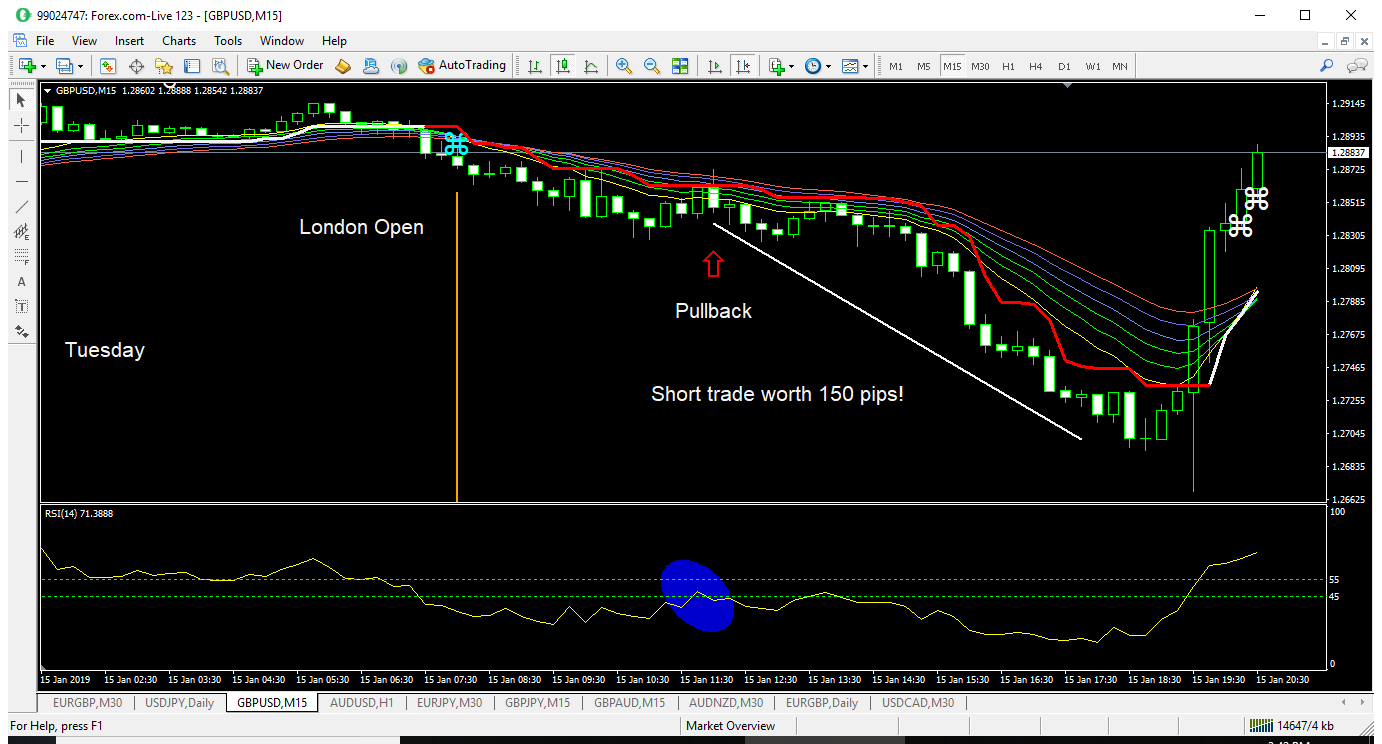
A final thought for this introduction to Trend Magic. As we have been recording this blog post, Prime Minister May has lost the vote badly in Parliament, 432-202. Volatility has increased and price has increased, as well. It has retraced much of the downleg of the day session.

When trading this kind of dramatic fundamental announcement, I would suggest taking my profit on the short sell in advance of the vote. Who knows how the brokers and large institutions will respond to the outcome? I have found that run-ups to an announcement are much easier to trade than the volatility of the announcement itself.
In this case, note that (unlike on our entry) price crashed up through the red Trend Magic barrier as well as up through the 55 RSI mid-range. This would be the short side stop loss exit point. Note that on the next candle Trend Magic turns from red to white!
Moral to the story. Trust your charts and indicators. Use your analysis of what might happen because of a fundamental announcement to plan trades PRIOR to the outcome. Then be prepared for crazy after the announcement takes place. You should be depositing your check by then!
If you haven’t already done so, please sign up as a Member of the Fortune Hunting crew! That will give you access to future blog posts and videos about indicators and templates that will power your Forex trading in 2019. Also, please leave a comment below if you have questions or would like to request analysis of another currency pair.
With that, Fortune Hunters… Let’s get some pips!


