On Wednesday, December 19th, the Federal Reserve will announce whether it will increase interest rates one more time in 2018. For several months, the Fed has forecast multiple hikes this year as the economy continued to improve and as the need for a modest tightening and a reversal of stimulation since the 2008 recession have clearly become necessary.
Recent developments, including an economic slowdown in China, continuing confusion about the outcome of Brexit and volatility in the world financial markets have raised doubt about whether another hike is justified. And President Trump has further complicated the Fed’s policy decision by criticizing the continuation of raising rates. The Fed has been boxed in by a policy decision contemplated for months.
Based upon previous blog posts, our readers understand not only that interest rate policy decisions drive currency valuations – but also that stronger economies and higher interest rates yield higher currency valuations. (and vice versa)
As the time for an important announcement approaches, industry watchers and traders will attempt to guess the outcome. Rumors will drive volatility. It doesn’t matter whether the guessing is correct. The market’s collective wisdom in advance of the decision often leads to trending prices.
These pre-announcement gyrations have been happening this week since the beginning of trading on Sunday night, especially in the USD.JPY (dollar/yen) currency pair. As a result, it’s a great topic for our blog post. It combines pullbacks in trend, why to avoid countertrend trades, Fibonacci retracements and fundamental announcements as overlapping themes all in one bundle.
From the London open, at 3:00 AM EST Monday morning, the value of the dollar began to drop. It was clear as the day progressed that traders believed a rate hike was off the table.
We posted a video on YouTube and Twitter about this as the sell off was continuing early Monday morning. You can see it here.
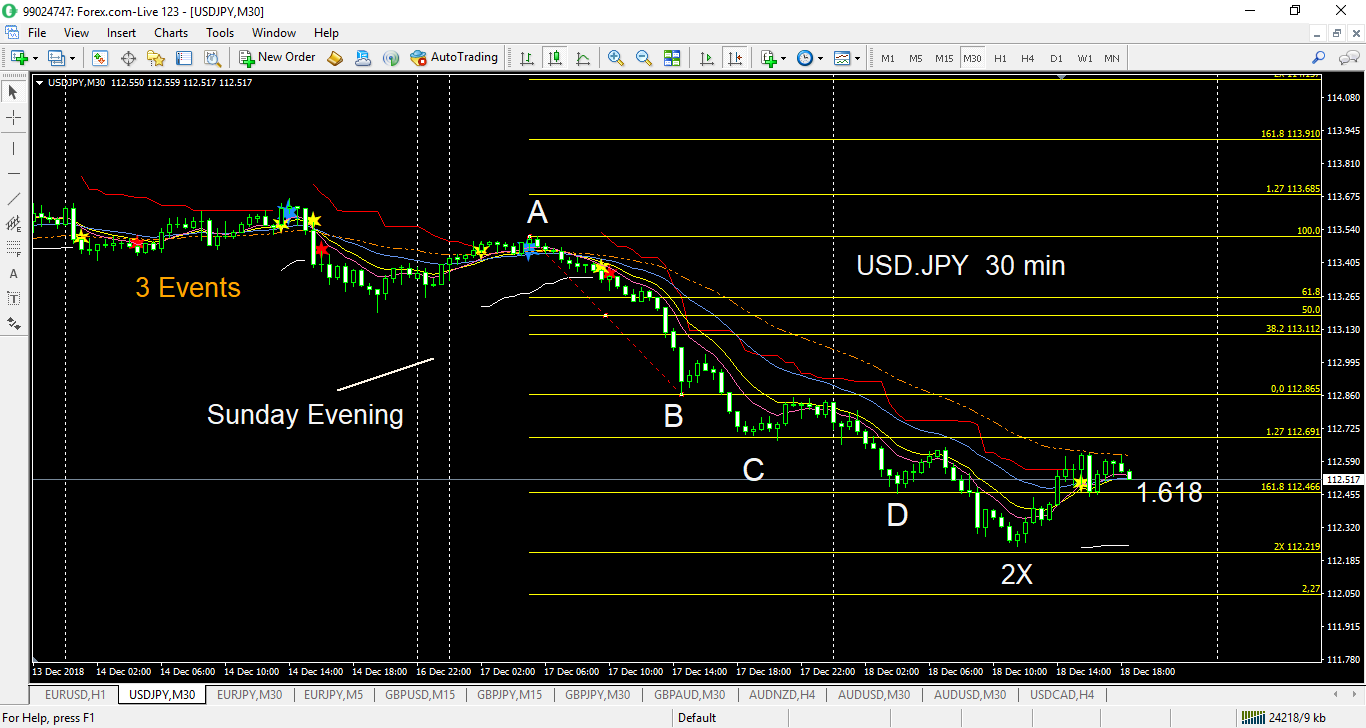
Clearly, the prevailing view that the Fed was not going to raise rates had a significant impact on the Dollar versus the Yen. Let’s take a look now at an image of the continuation of trading Monday and into Tuesday. As we mentioned in the video, using Fibonacci retracements in combination with our trading strategy of waiting for pullbacks in a strong trend before entering a trade, let’s see how the Fib targets worked out. I switched to this 30 min chart of the USD.JPY on December 16-18 so we could see more price action in a single view.

When we posted the video yesterday, price had dropped to approximately 1.1290, (from point A to point B) on the chart. This was the original thrust down in the Fibonacci sequence. We predicted on the video that there might be a pullback before continuation to the 1.27 level at point C. That played out — but the sellers were in control and the countertrend pullback into the bands could only get to the 12 EMA before resuming the main trend lower.
From point C at the 1.27, there is another pullback that struggles to get back to the zero line at the end of the Monday trading day. Quickly in the Asian session, price continues to the 1.617 Fib extension at D. And finally we get to 2X the distance of the original thrust before a more significant pullback suggests the initial price targets have been reached.
This chart seemed a great example of classic Fibonacci wave action — combined with anticipation of a fundamental announcement. The Fib levels don’t always work out so neatly — but when they do, it is fun (and profitable) to watch!
If you have any questions, please post them in the comments box. Good trading!


